
Who Is Missing from Our Early Intervention Program? Using Data to Strengthen Child Find
By Margaret C. Gillis and Brian Barger
The Individuals with Disabilities Education Act (IDEA) requires Part C early intervention (EI) programs to identify and serve infants and toddlers with disabilities or developmental delays and their families. To meet this responsibility, states implement comprehensive child find systems to identify children who may be eligible, refer them to EI, determine eligibility, and provide services for eligible children and families.
But how can a state or local EI program know whether its child find system is reaching as many children as it should?
Programs have data on how many children they serve and can compare those numbers with the population of infants and toddlers in their state or community. States also monitor the percentage of the population receiving EI and set targets for the percentage they expect to serve.
These data are important, but they leave a key question unanswered: How many children in the population are likely to need EI services?
Through the Child Find ACCESS project, we explored an additional way to help answer this question. We looked at whether data on children receiving special education later in childhood could help local programs estimate how many infants and toddlers they might reasonably expect to identify through Part C.
To help answer this question, we applied a missingness analysis approach from recent applied measurement research to Part C and Part B systems data1. Rather than providing a definitive number of children who were missing, the analysis can help programs identify potential patterns in their data – and then determine where they may want to look more closely.
Why Look at Missingness
States vary widely in the percentage of infants and toddlers they serve through Part C. There are many good reasons for some of this variation. States have different eligibility criteria, populations, policies, and service systems. Families can also choose whether to participate in EI.
Programs can look at their own historical data, population trends, birth rates, and comparisons with other states or communities to determine whether their child count appears credible. Missingness analysis considers another credible source: data about children who are identified with disabilities later in childhood.
Part B of IDEA provides special education and related services to children with disabilities beginning at age 3. Some children receiving Part B services have disabilities or developmental needs that may have been identifiable earlier, during the birth-to-3 period.
Looking at Part B data can therefore provide a credible reference point for Part C programs. If a community has a certain level of need for special education among older children, what might that tell us about the number of younger children we could reasonably expect Part C to be reaching?
What to Consider Before Comparing Part C and Part B
Before making this comparison, it is important to recognize that Part C and Part B serve different populations:
- Part C serves infants and toddlers who have developmental delays or diagnosed conditions associated with a high probability of a developmental delay.
- Part B serves children who have a disability and, because of that disability, need special education and related services.
Thus, we would not expect every child who receives Part C services to later receive Part B services – or every child who receives Part B services to have previously received Part C.
For example, a child might receive EI for a developmental delay, make progress, and no longer need services by the time they reach preschool. Conversely, a child’s disability or need for special education might not become apparent until after the child leaves the age range for Part C.
Applying missingness analysis to data therefore requires more than simply comparing Part C and Part B child counts. It requires working with people who understand both systems to determine which children represented in Part B data could credibly have had developmental needs that were identifiable during the birth-to-3 period.
How Missingness Analysis Works
We tested this approach in three North Carolina counties participating in the Child Find ACCESS project. The analysis brought together three main sources of data:
- Part C child count data on infants and toddlers receiving EI
- Part B child count data on older children receiving special education
- Census data on the population of children in each county
Bringing the datasets together was only part of the process. Community and state partners were critical to interpreting what the data meant and whether the comparisons were appropriate.
So in each county we convened a “leadership team” of community partners, and together we worked through the process below to understand patterns across the data sources. We then shared the approach and results with a state leadership team of cross-sector state partners to gain additional insights.
Deciding Which Part B Data to Use
One of the first questions was which children receiving Part B services should be included in the analysis.
We worked with leadership team members familiar with Part C and Part B in the three counties to identify disability categories that they believed could reasonably represent children whose needs might have been identified during the birth-to-3 period.
For some Part B disability categories, leadership team members determined that most or all children could reasonably have had needs that were identifiable earlier. For other categories, they determined that only a portion of children should be included.
For example, the analysis included all children classified in several categories, including autism, hearing impairment, intellectual disability, visual impairment, and multiple disabilities. Leadership team members determined that it was more appropriate to include only 25% to 50% of children with speech or language impairment or other health impairment because most children in those categories would be expected to be identified after age 3.
These decisions reflected the knowledge and perspectives of the partners involved in North Carolina’s programs, including their knowledge of how disability categories are applied in Part B. Teams conducting missingness analysis elsewhere will likely make different decisions based on their own eligibility criteria, populations, and local context.
Making Sure We Were Comparing the Same Community
We also needed to ensure that the Part C, Part B, and Census data represented the same geographic population.
For each of the three North Carolina communities participating in the Child Find ACCESS project, we were able to examine both Part C and Part B data at the county level and use county Census data as the common population denominator. However, county-level Census data were available only for the birth-to-5 population. So we estimated the birth-to-3 population to be 60% of the birth-to-5 population and used that number for our calculations.
This step is easy to overlook, but it is essential. If one dataset includes children who are not included in another dataset from the same county, the results can create an apparent gap. This is really a data issue rather than a child find issue.
If a leadership team needs to examine data organized in a different way, such as for a metropolitan area spanning parts of multiple counties or with multiple local programs serving the same county, it may be more difficult with the data available. In such cases, the team may need to consider the data available and what is needed to obtain a comparable dataset.
For example, when multiple local programs serve the same county, the leadership team may need to work with the other local programs in the county to get the total number of children in the county served by any Part C program. Similarly, the team may need to work with multiple school districts or with the state Part B program to obtain the total number of children in the county served by Part B.
Calculating Potential Missingness
Once we defined the population and selected the relevant Part B data (Step 1 in the box), we used a relatively simple calculation.
First, we calculated the proportion of children ages 5–9 in the county (Census5–9) who were represented in the selected Part B disability categories (Step 2).
Next, we applied that proportion to the Census population of children from birth through age 3 (CensusB–3). This gave us an estimate of the number of younger children we might expect to see in Part C based on the pattern observed among older children (Step 3).
Finally, we compared that expected number with the total number of children served by Part C (Step 4).
When Part C served fewer children than expected, the difference represented potential missingness based on inferences from credible data sources interpreted by local leadership team members based on local context (Step 5).
The word potential is important. The calculation does not tell us that a specific number of eligible children were definitely missed by Part C. Instead, it identifies a pattern that the leadership team may want to explore.
Calculating Missingness
Step 1. Identify the Part B disability categories that could reasonably reflect needs identifiable before age 3.
Step 2. Calculate the proportion of children in Part B in relation to Census (Part B ÷ Census5–9).
Step 3. Multiply output of Step 1 by CensusB–3.
Step 4. Subtract output of Step 2 by the total number of Part C child count data.
Step 5. Interpret output. A positive number indicates the number potentially missing from Part C. A negative number indicates the Part C program potentially served more children than expected.
What the Data Showed in One Community
For one of the North Carolina communities in the Child Find ACCESS project, looking across multiple years helped the leadership team see a pattern that would have been difficult to identify from a single child count.
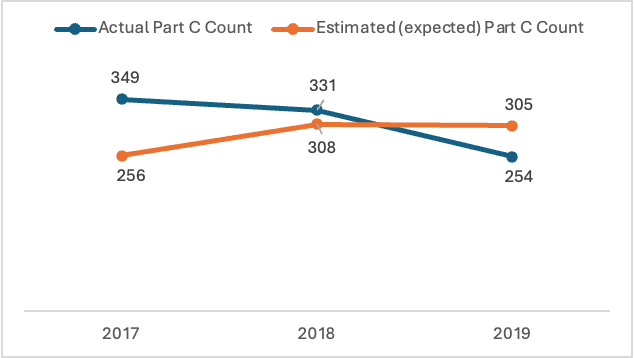
In 2017, the county had 10,827 children ages 5–9 and 474 children in the selected Part B disability categories. Based on that rate (Part B ÷ Census5–9) and the county’s birth-to-three population (CensusB–3) of 5,858, we estimated that approximately 256 children might be expected to receive Part C services.
The actual Part C count was 349 children – about 93 more than the estimate.
In 2018, the difference narrowed. The analysis estimated approximately 308 children, compared with an actual Part C count of 331 – about 23 more children than expected.
Then, in 2019, the pattern changed. The estimate suggested approximately 305 children might be expected, while Part C served 254 children – about 51 fewer children than expected.
Looking across the three years, the leadership team saw a shift from serving more children than the estimate predicted to serving fewer.
Difference
(actual minus expected)
|
2017 |
+93 |
|
2018 |
+23 |
|
2019 |
-51 |
Did that mean the Part C program missed exactly 51 eligible children in 2019? No.
Instead, the analysis raised questions the community could explore:
- What changed between 2017 and 2019?
- Did referral patterns or referral sources change?
- Were fewer children being identified through developmental screening?
- Did staffing, eligibility practices, or community outreach change?
- Were there changes in the population that the available data did not capture?
- Do these numbers simply reflect year-to-year variation?
Answering these questions requires bringing the data back to people who know the local child find system.
Why Community Context Matters
Our experience in another North Carolina county showed why community interpretation is so important.
The missingness analysis suggested that this county had a large number of potentially missing children in each of the three years we examined (2017–2019). If we looked only at the numbers, we might have concluded that the county had a significant child find problem.
However, conversations with community partners uncovered an important piece of context: the county includes a large military base.
A large number of children in the community live on the military base and are served by the military schools and EI program. This raised questions about whether those children were represented consistently across the Census, Part C, and Part B datasets available to us.
Without additional data, we could not confidently determine whether the apparent gap represented children who might have been missed by Part C or simply populations that were represented differently across the datasets. We therefore determined that the missingness estimates for that county were not interpretable with the available data.
That finding was useful, too. It helped identify an important gap in the data and showed which additional partners and information would be needed to better understand the community’s child find system.
For guidance on engaging community partners in child find system improvement efforts, see the Child Find ACCESS Model Guide.
How to Use Missingness Analysis to Ask Better Questions
For many reasons, it is inappropriate to use missingness analysis to grade Part C programs or produce a definitive number of children who should be receiving EI. Instead, it provides another way for state and local teams to examine their child find data, identify patterns, and decide where deeper investigation or targeted community conversations may be useful.
The Child Find ACCESS project reinforces several lessons for teams interested in trying this approach:
- Start with the data you have, but understand their limitations. Part C, Part B, and Census data are collected for different purposes and may not align perfectly.
- Engage people who understand both Part C and Part B. Their perspectives are essential for deciding which comparisons are meaningful.
- Look at patterns over time rather than relying on a single year. Changes across years may be more informative than an estimate for one year only.
- Bring the findings back to the community. The calculation can show where something unexpected may be happening. Families, providers, local program staff, and other community partners can help explain why.
- Treat unexpected findings as questions, not conclusions. Sometimes, a pattern may point to an opportunity to strengthen child find. Other times, as we found in the county with the military base, it may point to limitations in the available data.
Part C programs have an important responsibility to find infants and toddlers who may need EI. No single dataset can tell them whether they are reaching every potentially eligible child.
By bringing together Part C, Part B, and Census data, along with the perspectives of the people who know their communities, state and local teams can ask a more useful question:
Do the children we are reaching reflect what we would reasonably expect in our community – and if not, what do we need to understand next?
Missingness analysis offers one more tool for starting that conversation and using data, together with community knowledge, to strengthen child find.
Citations
- Barger, B., Pigott, T. D., Sheldrick, R. C., Campbell, J., Gonzalez Laca, A., Starnes, J., Davis, B., Waford, R., & Olmstead, J. (2026). Estimating the impact of missed cases on the accuracy of autism screening tools. Psychological Assessment, 38(6–7), 487–502. https://doi.org/10.1037/pas0001445 ↩︎
Learn More
Access more resources related to Child Find ACCESS on our Resources Page.
About the Authors

Margaret C. Gillis, PhD, is a Principal Education Researcher and Technical Assistance Specialist with expertise in early childhood workforce development; early childhood, early intervention, and early childhood special education systems and policy; infant/toddler development and learning; inclusive practices; and evaluation. She uses mixed methods in applied research and technical assistance to understand complex concepts and support programs and systems. Dr. Gillis leads the Child Find ACCESS project.

Brian Barger, PhD, is a Research Associate Professor of Population Health Sciences at Georgia State University’s Mark Chaffin Centers for Healthy Development (Center for Leadership in Disability) and a consultant on the Child Find ACCESS project. Dr. Barger’s research blends epidemiological, psychometric, and education/health service methods to clarify how children with social, emotional, and developmental disabilities are identified in their communities and connected to community-based interventions (such as early intervention or childhood special education).